Contact Kelly McNamara for information on products, services or locations.
Choosing a metal material in 2026 means balancing strength, weight, cost, availability, and manufacturing demands. A part that performs well in a CAD model may behave differently after machining, welding, or exposure to moisture. Small details matter: a bracket’s thickness, a fastener’s coating, or the temperature around a cutting tool can change the result. No alloy wins everywhere.
Industry data helps explain why material choices deserve careful attention. The World Steel Association reported 1,882.6 million tonnes of global crude steel production in 2024, underscoring steel’s enormous manufacturing role. The USGS Mineral Commodity Summaries 2025 tracks production, reserves, and trade across mineral commodities, offering useful context for evaluating supply and sourcing. But broad market figures cannot predict whether a specific grade will meet a component’s fatigue, corrosion, or weight targets. That takes engineering judgment—and, ideally, testing under realistic conditions.
This guide compares ten widely used metals and alloys, including steel, aluminum, copper, and titanium. It considers practical factors such as machinability, durability, density, and relative cost, rather than treating one specification as a universal answer. Some comparisons remain approximate: prices shift, supplier grades vary, and published properties do not capture every shop-floor constraint. Use the list as a starting point, then verify the relevant grade, process, and performance requirements before choosing a material.
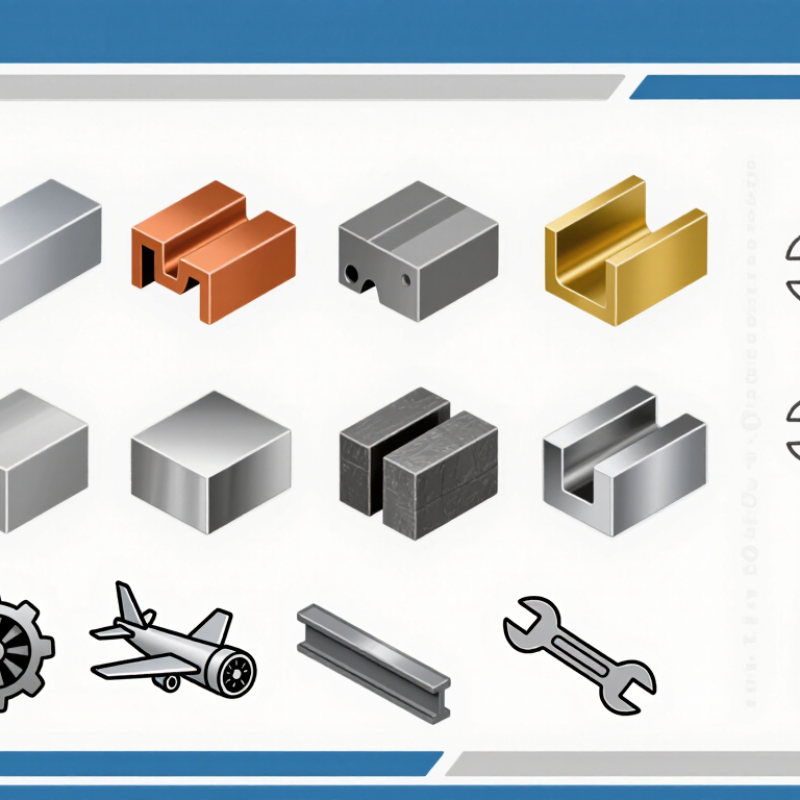
For 2026 sourcing, compare metals by grade, temper, strength, corrosion resistance, weight, and machining needs—not by name alone. ASTM A36 carbon steel is widely used for structural parts; ASTM A240 Type 304 stainless steel offers general corrosion resistance, while Type 316 adds molybdenum for harsher environments. ASTM B209 6061-T6 aluminum is light and heat-treatable. ASTM B152 C11000 copper conducts electricity well, while ASTM B16 C36000 brass machines easily. ASTM B265 Grade 2 titanium resists corrosion at relatively low weight. Nickel 200 (ASTM B160) suits applications needing high-purity nickel. AZ31B magnesium (ASTM B90) is exceptionally light; D2 tool steel (ASTM A681) is valued for wear resistance; zinc alloy 3 is commonly specified under ASTM B86 for die castings. Check the exact product form and revision.
Scale matters. World Steel Association’s World Steel in Figures 2024 reports 1.892 billion tonnes of crude steel production in 2023, reflecting steel’s manufacturing reach, not a guarantee of suitability. A thick A36 plate and a thin 6061-T6 bracket behave very differently under load. Compare certified mechanical data at the intended thickness, then assess forming, joining, finish, and total part cost.
Tips: Ask suppliers for material test reports and confirm the ASTM grade, temper, and dimensions. Match the test method to the part’s real service conditions. Small detail, big consequences. ASTM specifications define requirements, but actual performance still depends on processing and design.
A practical comparison of common manufacturing metals by specification, representative strength, density, corrosion resistance, and typical applications.
| Material | Common ASTM Specification / Grade | Representative Yield / Tensile Strength (MPa) | Density (g/cm³) | Corrosion Resistance | Manufacturing Characteristics | Typical Applications |
|---|---|---|---|---|---|---|
| Carbon Steel 1018 | ASTM A108; SAE 1018 (cold-finished bar) | About 370 / 440, typical cold-drawn condition | 7.87 | Low; usually needs coating or other protection | Good machinability and weldability; suitable for turning, drilling, and forming | Shafts, pins, spacers, fixtures, and general-purpose machined parts |
| Carbon Steel 1045 | ASTM A108; SAE 1045 (condition-dependent) | About 310 / 570, typical normalized condition | 7.85 | Low; susceptible to rust without protection | Higher strength and wear resistance than 1018; machinability is moderate, weldability is limited | Gears, axles, shafts, crank components, and machine parts |
| Carbon Steel A36 | ASTM A36/A36M | Minimum 250 / 400–550 for common structural plate ranges | 7.85 | Low; protective finishing is typically required | Good weldability and formability; widely available in structural shapes and plate | Frames, brackets, base plates, supports, and welded structures |
| High-Strength Low-Alloy Steel Grade 50 | ASTM A572/A572M Grade 50 | Minimum 345 / 450 | 7.85 | Low to moderate; not a stainless or weathering grade | Higher strength-to-weight ratio than A36; good structural weldability with suitable procedures | Load-bearing frames, bridges, equipment structures, and heavy-duty platework |
| Stainless Steel 304 | ASTM A240/A240M Type 304 | Minimum 205 / 515 for common sheet and plate requirements | 8.00 | Good in many atmospheric and mild chemical environments | Excellent formability and weldability; work-hardens during machining | Food-processing equipment, enclosures, tanks, kitchen components, and architectural parts |
| Stainless Steel 316L | ASTM A240/A240M Type 316L | Minimum 170 / 485 for common sheet and plate requirements | 8.00 | Very good; molybdenum improves resistance to chloride-related corrosion compared with 304 | Good weldability; low carbon content helps reduce sensitization risk after welding | Marine hardware, chemical equipment, pharmaceutical components, and welded tanks |
| Aluminum 6061-T6 | ASTM B209 (sheet/plate); ASTM B221 (extrusions), alloy 6061-T6 | About 276 / 310, representative T6 values; product dimensions affect limits | 2.70 | Good atmospheric resistance; anodizing can improve surface protection | Good machinability and strength-to-weight ratio; weldable, though heat can reduce local strength | Machine components, brackets, frames, fixtures, and general-purpose structural parts |
| Aluminum 7075-T6 | ASTM B209 (sheet/plate); ASTM B211 (bar/rod), alloy 7075-T6 | About 503 / 572, representative T6 values; product dimensions affect limits | 2.81 | Fair to moderate; less resistant to corrosion than 6061 and often protected in service | Very high strength and good machining response; generally not selected for fusion welding | High-strength machined parts, aerospace components, tooling, and sporting equipment |
| Commercially Pure Copper C11000 | ASTM B152/B152M, copper sheet, strip, plate, and rolled bar | Annealed values are approximately 69 / 205; temper has a large effect | 8.94 | Good in many environments; surface patina may develop | Excellent electrical and thermal conductivity; very formable, but comparatively difficult to machine | Bus bars, electrical conductors, heat exchangers, terminals, and plumbing components |
| Titanium Grade 5 (Ti-6Al-4V) | ASTM B265 Grade 5 (plate, sheet, and strip) | Minimum 828 / 895 for commonly specified Grade 5 product forms | 4.43 | Excellent in many oxidizing, marine, and physiological environments | High strength-to-weight ratio; machining requires controlled cutting conditions, and welding needs proper shielding | Aerospace structures, medical components, marine parts, and high-performance equipment |
Data note: Strength figures are representative values, not a substitute for the applicable material certificate or ASTM specification. Minimum requirements and typical properties vary by product form, thickness, temper, heat treatment, and test method. Confirm the exact grade, condition, and specification before design or procurement.
Carbon and tool steels have a typical density of about 7.85 g/cm³, or 7,850 kg/m³. This figure is a useful starting point when estimating part weight, machine loads, or shipping mass. A steel block measuring 10 × 10 × 10 cm weighs roughly 7.85 kg before machining. Real values vary slightly with composition and processing, so the number should not replace a material specification.
That difference matters. Carbon steel is often selected for structural parts, shafts, and brackets where strength and cost are key concerns. Tool steel is designed for demanding cutting, forming, or wear conditions, and its alloying elements can shift its density modestly. For most early weight estimates, the change is small; for precision assemblies, it may matter. Check the supplier’s data.
Density alone does not tell you whether a steel suits a part. Hardness, heat treatment, corrosion exposure, and machinability also affect performance. A heavy steel component can increase a moving assembly’s inertia, even when its dimensions seem compact. It is easy to overvalue one clean number. I would verify the grade and finished-part dimensions before making a close weight estimate.
For manufacturing in 2026, stainless steel 304 and nickel alloy 625 serve different jobs. ASTM A240/A240M specifies 304 at 18–20% chromium and 8–10.5% nickel. That chromium helps form a protective passive surface, useful on fabricated tanks, food-processing equipment, and indoor components. But 304 is not immune to chloride pitting; salty washdown areas may need a more careful material review. A clean specification is not the whole story.
Alloy 625 contains at least 58% nickel, with 20–23% chromium and 8–10% molybdenum under ASTM B443. Its chemistry supports corrosion resistance in demanding chemical and marine environments, while its strength also suits hot-section parts. The trade-off is cost and machining effort. More nickel is not automatically better. The USGS Mineral Commodity Summaries 2025 estimated global mined nickel output at 3.7 million metric tons in 2024, with Indonesia supplying about 2.2 million. Those figures describe mine supply, not finished-alloy availability, but they underline why buyers should check lead times alongside performance. Real parts vary. Welds, surface finish, temperature, and cleaning practices can shift the result, so a coupon test may be worth the extra time.
For a one-liter volume, aluminum at 2.70 g/cm³ weighs about 2.70 kg. Magnesium, at 1.74 g/cm³, weighs roughly 1.74 kg. Titanium, at 4.51 g/cm³, reaches about 4.51 kg. These figures make the weight contrast tangible, but they describe material density, not the finished component’s mass. Wall thickness, ribs, holes, and overall shape matter just as much.
Mass adds up. In a handheld enclosure or moving arm, magnesium can reduce the load noticeably compared with aluminum. Aluminum remains a practical middle ground when stiffness, corrosion behavior, and manufacturing needs must be balanced. Titanium is heavier by volume, yet its strength can support thinner sections in some designs. That does not guarantee a lighter part; geometry and loading decide. I have to resist treating density as a shortcut to a final material choice.
These values are representative, not universal constants for every alloy or condition. Exact composition and temperature can shift measured density slightly, while heat treatment usually changes strength more than density. A sound comparison uses the same part geometry and checks stiffness, fatigue, joining, cost, and machining requirements. A quick mass estimate is useful. It is not a full design review.
In electrical manufacturing, annealed copper’s conductivity benchmark is 100% IACS. The International Annealed Copper Standard expresses conductivity as a percentage of reference annealed copper under specified conditions. A reading near 100% does not mean every copper part performs identically. Alloy content, cold work, temperature, and measurement method can shift results. Small details matter.
Annealing softens copper after forming and can restore conductivity affected by deformation. A busbar, for example, may be bent around a tight corner, then checked for resistance and heat rise. Copper carries current efficiently, but its softness can complicate threaded joints or parts exposed to repeated vibration. That trade-off is easy to miss. Confirm temper, dimensions, and test conditions in the material documentation rather than relying on one headline percentage.
Brass and zinc offer different balances. Brass, a copper-zinc alloy, generally trades some conductivity for strength and machinability; exact performance depends on composition. Zinc is often chosen for die-cast shapes or protective coatings, not as a direct substitute for copper conductors. Compare grade data, joint design, and operating temperature. A connector’s contact resistance can still dominate the result.
Electrical conductivity is shown as a percentage of the International Annealed Copper Standard (IACS), with annealed copper set at 100%. Values are approximate typical figures near 20°C; alloy composition, purity, and temper can change results. Brass is represented by a typical brass value.