2026 Top Steel Metal Manufacturers Worldwide?
The 2026 Top Steel Metal Manufacturers Worldwide? This question deserves more than a simple production ranking. A serious comparison must examine crude steel output, product quality, technology, delivery reliability, and environmental performance. These factors reveal how manufacturers perform inside real factories, construction sites, and automotive supply chains.
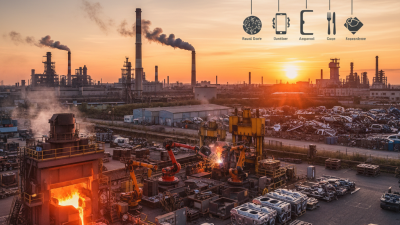
The global leaders usually include companies such as China Baowu, ArcelorMittal, Nippon Steel, POSCO, and HBIS Group. However, rankings can change when researchers use different reporting years, ownership structures, or production definitions. Some companies report consolidated output, while others separate regional subsidiaries. That detail matters. A massive furnace, glowing orange at night, does not tell the whole story.
Lakshmi N. Mittal has described steel as “the backbone of modern society.” His statement explains why steel metal remains vital for bridges, railways, wind turbines, hospitals, and electric vehicles. Yet the industry faces difficult questions about carbon emissions, energy costs, raw-material security, and recycling capacity. The strongest manufacturers are investing in electric arc furnaces, hydrogen research, automation, and cleaner power. Progress is visible, but incomplete. Green steel claims also require careful verification, not attractive slogans.
This guide evaluates leading manufacturers through measurable evidence, including annual reports, recognized industry data, production capacity, geographic reach, and customer applications. It also considers practical weaknesses, because no producer leads in every category. A company may offer excellent automotive steel but struggle with delivery speed. Another may produce enormous volumes but still depend heavily on carbon-intensive processes. That uncertainty deserves honest attention.
Global Steel Industry Overview in 2026
Global Steel Industry Overview in 2026
The global steel market enters 2026 with cautious growth and uneven regional demand. The World Steel Association’s 2025 Short Range Outlook projected stronger steel consumption in 2026 after limited growth in 2025. Construction, transport equipment, energy infrastructure, and machinery remain major demand sources. Asia still controls most crude steel output, while Europe and North America face higher energy and compliance costs. Production leadership remains concentrated among large national markets, not a single manufacturer.
The International Energy Agency estimates that steel production creates roughly 8% of global energy-related emissions. This pressure is reshaping investment decisions. Electric arc furnaces, higher scrap use, hydrogen trials, and carbon management are gaining attention. However, clean production remains expensive and unevenly available. The World Steel Association reported global crude steel output near 1.9 billion tonnes in 2024, showing the industry’s enormous physical scale. Yet volume alone can mislead. Profitability, emissions intensity, product quality, and delivery reliability matter more in 2026.
Tips:
Compare suppliers using verified production data, energy sources, recycled content, and regional delivery records. Check the reporting year carefully. Forecasts can age quickly. A factory may appear efficient on paper, but its power mix and raw material distance deserve closer review. Industry data is useful, not perfect. Weather, trade policy, and weak construction could still change demand faster than expected.
Criteria for Ranking the Top Steel Manufacturers
A credible 2026 ranking should begin with comparable evidence, not advertising claims. The World Steel Association’s World Steel in Figures 2025 reports about 1.89 billion tonnes of crude steel production in 2024. That figure measures scale, but scale alone can mislead. A producer may ship huge volumes while losing quality consistency or regional reliability.
Production could represent 25% of the score, based on audited tonnage and capacity utilization. Product mix deserves another 20%, covering automotive sheet, structural plate, stainless grades, and high-strength steels.
The ranking should examine defect rates, delivery performance, and technical support. The World Steel Association’s sustainability indicators can guide comparisons of emissions, energy use, and reporting boundaries. Numbers without clear boundaries remain weak evidence.
Environmental performance should not rely on promises. Assess scrap use, renewable electricity, water recycling, and emissions per tonne. OECD steel analysis has repeatedly highlighted global excess-capacity risks, making utilization and capital discipline important measures. Financial reports can reveal whether maintenance and decarbonization plans are affordable. Safety records matter too, especially lost-time injury rates and contractor controls. Customer interviews may expose problems hidden in polished disclosures. This method is imperfect. Regional data gaps will remain. Still, verified production records, independent assurance, certification evidence, and multi-year trends offer a stronger basis than a single annual ranking.
Leading Steel Manufacturers by Production and Market Reach
2026 Top Steel Metal Manufacturers Worldwide?
Leading Steel Manufacturers by Production and Market Reach
The leading steel manufacturers in 2026 will be measured by output, product range, and dependable market access. Crude steel volume remains important, but it tells only part of the story. A producer may rank highly while serving fewer specialized industries.
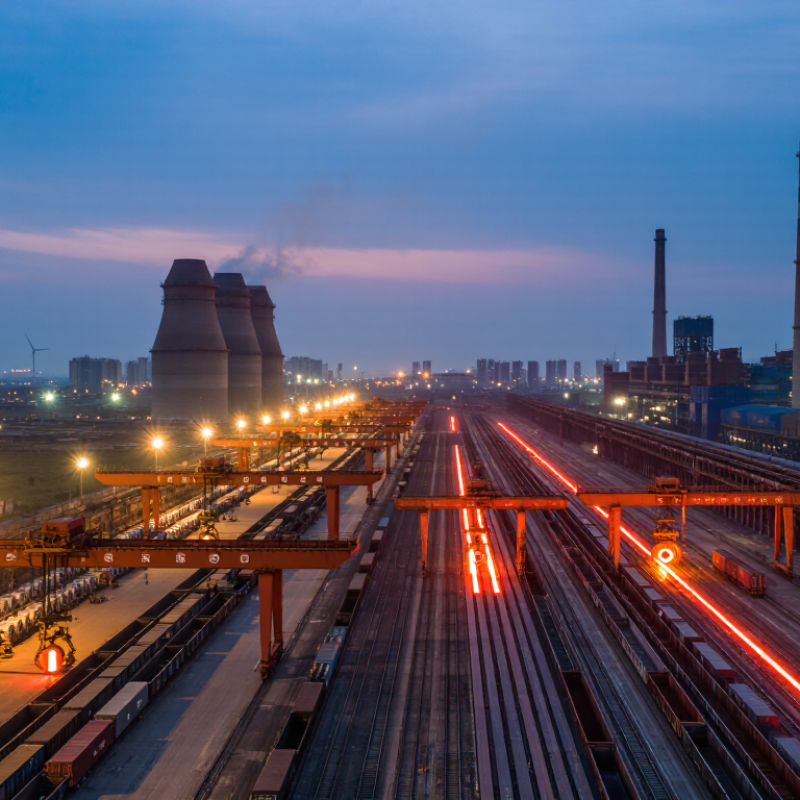
Large manufacturers typically operate integrated plants near iron ore routes, ports, and major industrial centers. Their facilities can produce construction beams, automotive sheet, railway steel, and corrosion-resistant alloys. Strong distribution networks help them deliver coils and plates across several regions with fewer delays.
Production scale matters.
Market reach also reflects local service centers, technical support, and consistent quality control. Buyers often examine delivery records, testing procedures, energy use, and compliance documentation before signing contracts. These details reveal operational strength better than a headline production figure.
The strongest producers are expanding electric furnaces, renewable power use, and systems that recover heat from high-temperature processes. Lower-emission steel is gaining attention, although costs and supply limitations remain serious obstacles.
Progress is uneven. Some facilities still depend heavily on coal-based production.
A practical 2026 comparison should review annual tonnage, export coverage, product certifications, plant efficiency, and customer diversity. Rankings can change quickly when raw material prices, trade rules, or regional demand shift. I would avoid treating any single table as permanent.
Even a respected producer can lose ground through delays, quality complaints, or weak investment in cleaner technology.
Key Technologies, Products, and Sustainability Practices
In 2026, leading steel manufacturers will be judged beyond annual output. World Steel Association data recorded about 1.89 billion tonnes of crude steel production in 2023. Scale still matters, but technology increasingly separates efficient producers from ordinary mills. Electric arc furnaces can melt high-quality scrap with flexible electricity use. Direct reduced iron plants can also replace part of traditional coal-based production. Hydrogen trials are promising, although commercial supply remains limited and expensive.
PRODUCT PERFORMANCE
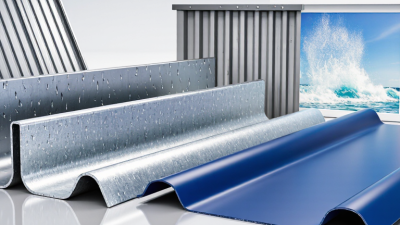
Advanced high-strength steel supports lighter vehicle structures, while coated sheets resist corrosion in bridges and renewable-energy equipment. Sensors now monitor furnace temperature, slab thickness, and surface defects in real time. Digital models can reduce waste before production begins. The International Energy Agency estimates that steel creates roughly 7% to 9% of global carbon dioxide emissions. That figure makes energy efficiency more than a marketing phrase.
Progress remains uneven. Some facilities report lower emissions, yet calculation methods differ across regions. The Greenhouse Gas Protocol and sectoral certification schemes can improve comparability, but reporting is not perfect. Scrap availability is another constraint. Cleaner furnaces cannot operate sustainably without reliable low-carbon electricity and traceable inputs. Water recycling, dust capture, and safer working conditions also deserve more attention. Carbon capture may help older assets, but it should not excuse delayed process change. The best manufacturers will combine measurable reductions, durable products, and evidence that independent reviewers can test.
Regional Influence and Future Growth of Major Steelmakers
2026 Top Steel Metal Manufacturers Worldwide?
Regional Influence and Future Growth of Major Steelmakers
In 2026, leading steelmakers will compete through regional strength, not production volume alone. Coastal mills benefit from deepwater ports, automated yards, and nearby energy terminals. Inland producers rely more heavily on rail networks and dependable raw material contracts. These practical differences shape delivery costs and customer loyalty.
Asia will remain the largest production center, supported by construction demand and expanding manufacturing zones. European producers face stricter carbon rules, encouraging electric furnaces, recycled scrap, and lower-emission power. North American mills may gain from infrastructure spending and reshoring projects. Growth is visible there.
Emerging markets could become important regional suppliers. Their advantages include younger workforces, new ports, and rising local demand. However, financing costs and unstable electricity supplies can delay major furnaces. This point deserves more attention. Future growth will depend on cleaner technology, skilled operators, and transparent emissions data. Hydrogen-based reduction offers promise, but costs remain uncertain and infrastructure is limited. Scrap availability also varies sharply between regions, making one global strategy unrealistic.
Steelmakers with flexible plants may respond faster to changing trade policies and customer needs. Yet scale can create weakness when demand suddenly falls. My assessment is cautious: regional influence will grow, but forecasts may overstate how quickly decarbonization becomes profitable. Even advanced facilities still face maintenance delays, supply disruptions, and difficult investment choices.
2026 Top Steel Metal Manufacturers Worldwide? – Regional Influence and Future Growth of Major Steelmakers
Country-level comparison of major steelmaking markets. Company and brand names are intentionally excluded.